So far we’ve looked at the zero-dimensional energy balance model (EBM), which treats Earth as a single uniform entity, so it can’t capture differences between latitudes. Solar radiation varies a lot from the equator to the poles, and ice feedbacks matter a great deal for regional climate, so we need to add a spatial dimension.
The One-Dimensional Energy Balance Model
Instead of treating Earth as a single lump, we split it into latitude bands, which lets us model how energy moves between regions.
In this version we divide the Northern Hemisphere into nine bands, each spanning 10 degrees of latitude, and then look at how each one gains and loses heat and exchanges energy with its neighbours.
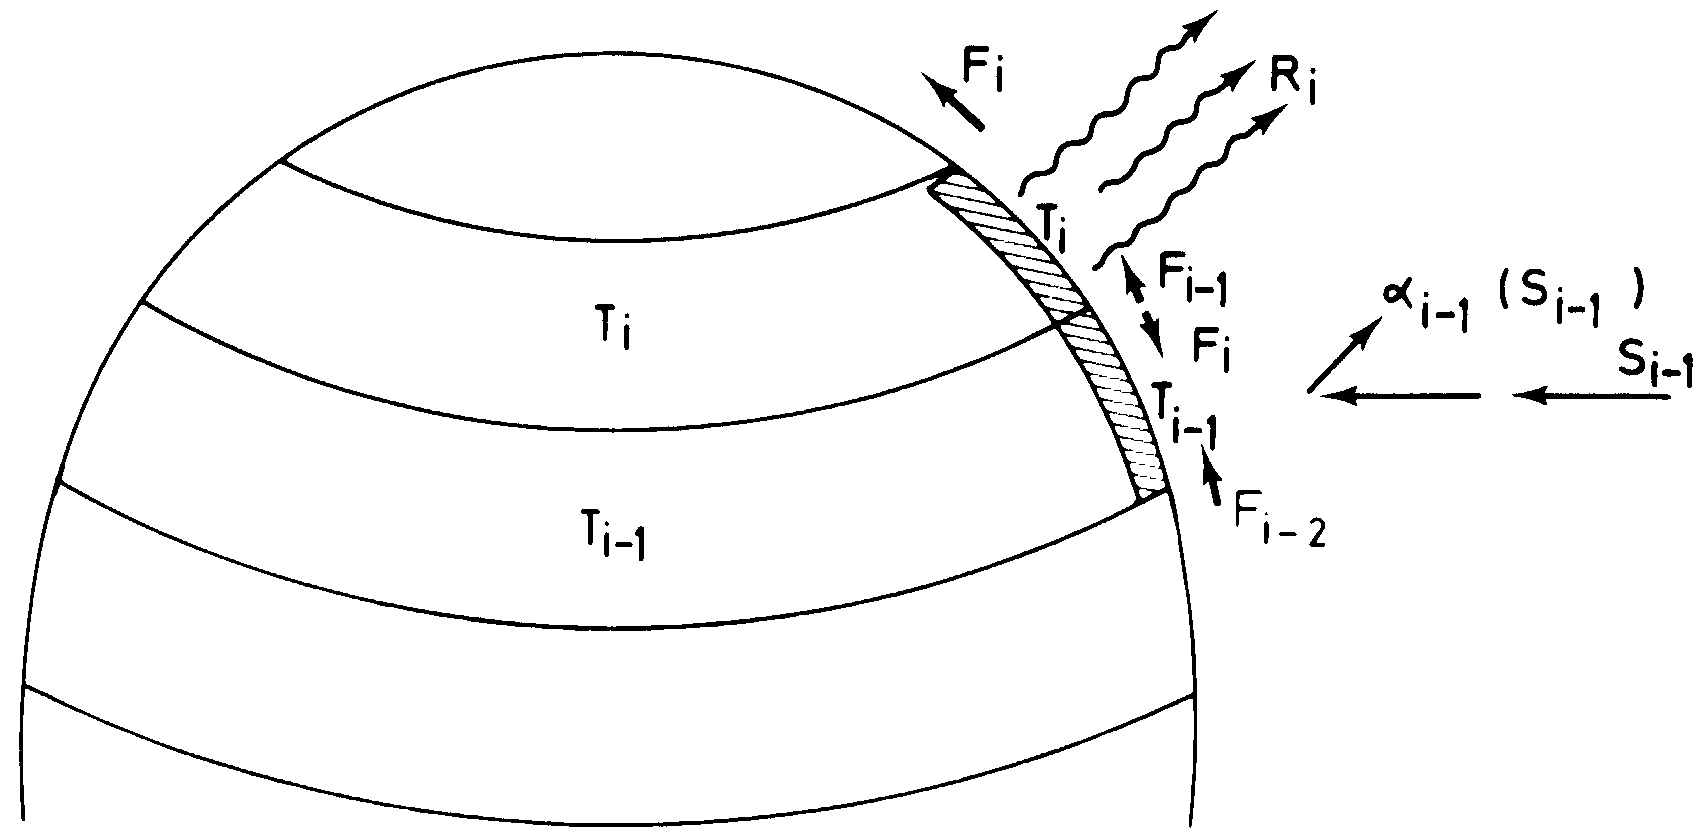
From Fig. 3.1 of Henderson-Sellers & McGuffie, A Climate Modelling Primer (Wiley, 1987)
Heat flows
In an energy balance model, the main goal is to account for all heat flows in and out of the system. In the model we are examining, both the solar flux and albedo vary with latitude. The solar flux is denoted by and the albedo is denoted by , where i ranges from 1 to 9 representing different latitude bands. The incoming heat flow for our system would be:
Here is already the average solar flux reaching band , so there is no division by 4. In the code, that quarter is inside SOL_FRAC.
The outgoing longwave radiation is approximated by a straight line in the surface temperature (Budyko, 1969):
where A and B are empirical parameters fitted to observations and is in °C. This is not from the Stefan-Boltzmann law. At 15 °C, gives about 237 , while gives about 391 . The difference is the greenhouse effect: the atmosphere absorbs much of what the surface emits. A straight line fits because of water vapour’s greenhouse effect (Koll & Cronin, 2018).
If a latitude band is colder or warmer than the global average, heat flows into or out of it. We assume this flow is proportional to the temperature difference , with the diffusivity, so the energy exchange among latitude bands is:
Energy balance gives us:
or:
Therefore:
Some Python code…
Model parameters & Variables
no_latbands = 9                #number of latitude bands
EPSILON = 1.*10**-6   #Small value to check the stable condition of the Model
# infrared radiation
A = 204. #infrared cooling ($Wm^{-2}$)
B = 2.17 #infrared cooling per degree ($Wm^{-2}$/degC)
# heat transfer
K = 3.81 #diffusivity ($Wm^{-2}$/degC) (for energy exchange among latitudinal bands)
# albedo parameterization
TEMP_C1 = 0. #1st temperature threshold --> no ice cover (degC)
TEMP_C2 = -10. #2nd temperature threshold --> complete ice cover (degC)
ALB_ICE_FREE = [0.23,0.24,0.25,0.29,0.35,0.40,0.46,0.50,0.50]
ALB_ICE = 0.62
# incoming solar radiation
S0 = 1368 #Solar constant ($Wm^{-2}$)
# SOL_FRAC = [0.30475,0.29725,0.28,0.25525,0.223,0.1925,0.156,0.13275,0.125]
SOL_FRAC = np.array([0.30475,0.29725,0.28,0.25525,0.223,0.1925,0.156,0.13275,0.125])
SOL_FLUX = S0*SOL_FRAC #incoming solar flux at each latitudinal band
# SOL_FLUX = np.array(SOL_FLUX)# Initiate zero arrays
no_latbands
# variables
alb = np.zeros(no_latbands)
temp = np.zeros(no_latbands)
temp_ini = np.zeros(no_latbands)
temp_pre = np.zeros(no_latbands)Estimating surface area of each band
band_width = 90/no_latbands                                            # number of degrees in each zone

# midpoint of each band
lats = []
for i in np.arange(band_width/2.,90.,band_width):
    lat = i
    lats.append(lat)
lats = np.array(lats)

# midpoint of each band in radians:
lats_rad = lats*np.pi/180

# half the number of radians in each band:
delta_rad = (np.pi/2)/no_latbands/2                          # =====> dp/2

# fraction of the surface of the sphere in each latitudinal band
lats_frac = np.sin(lats_rad + delta_rad) - np.sin(lats_rad - delta_rad)
Albedo for each band and mean albedo
The mean albedo alb_mean is the ice-free albedo of each band (ALB_ICE_FREE), weighted by the band’s share of the surface (lats_frac).
alb = np.array(ALB_ICE_FREE)
alb_sum = 0
for i in range(1,no_latbands+1):
    alb_sum += alb[i-1]*lats_frac[i-1]
alb_mean = alb_sum/sum(lats_frac)
Function for finding temperature
The function ebm1d(a, b, k, i) below finds the equilibrium temperature of each latitude band for given values of A, B and K, with i = 1 for a planet entirely covered by ice and i = 0 otherwise. It iterates until the temperatures stop changing, updating each band’s albedo from its temperature.
def ebm1d(a,b,k,i):
    global A, B, K, no_latbands, lats, alb, temp

    # set up iterations:
    temp[:] = ((S0/4.)*(1-alb_mean)-A)/B
    step_num = 1
    max_temp_diff = 1.
    tol_temp_diff = 1e-6
    max_steps=100

    A = a
    B = b
    K = k

    while (step_num<max_steps) and (max_temp_diff>tol_temp_diff):
        temp_pre = temp
        step_num+=1

        #calculate albedo:
        if i==1:
            alb[:] = ALB_ICE
            strg = 'icy'
        else:
            strg = 'not icy'
            for j in range(1,no_latbands+1):
                if (temp_pre[j-1] <= TEMP_C2):
                    alb[j-1] = ALB_ICE
                    # print('1')
                elif (temp_pre[j-1] > TEMP_C1):
                    alb[j-1] = ALB_ICE_FREE[j-1]
                    # print('2')
                else:
                    alb[j-1] = ALB_ICE + (ALB_ICE_FREE[j-1] - ALB_ICE)*(temp_pre[j-1] - TEMP_C2)/(TEMP_C1 - TEMP_C2)
                    # alb[j-1] = (TEMP_C1 - temp_pre[j-1])/(TEMP_C1 - TEMP_C2) * ALB_ICE + (temp_pre[j-1] - TEMP_C2)/(TEMP_C1 - TEMP_C2)*ALB_ICE_FREE[j-1]
                    # print('3')
        alb = np.array(alb)
        #update temperature:
        temp_avg = sum(np.multiply(lats_frac,temp))
        # print(alb)
        temp = (np.multiply(SOL_FLUX,(1-alb)) + K*temp_avg - A)/(B+K)
        max_temp_diff = max(abs(temp_pre - temp))
    array = np.array([lats,temp,alb])
    array = np.transpose(array)
    index_vals = np.arange(1,no_latbands+1,1)
    column_vals = ['Latitude (degree)','Equilibrium Temperature (degC)','Equilibrium Albedo']
    df = pd.DataFrame(data = array, index = index_vals, columns = column_vals)
    display(df)
    fig = plt.figure(figsize=(10,6))
    plt.plot(lats,temp,c='maroon',lw=2,label='Equil. Temperature (degC)')

    plt.title(f'Model A={A}, B={B}, K={K}, {strg}')
    plt.xticks(np.arange(0,95,5))
    # plt.yticks(np.arange())
    plt.legend()
    plt.grid()
    plt.show()
With the function created above, all we have to do now is to enter the parameters A, B, K and decide whether the Earth is entirely covered by ice or not.
Examples
An ice-covered Earth
For this case, I entered the values for A, B and K, and i = 1 to notify that this is an icy case. The absorbed solar flux for each latitudinal band can be found in the following table:
ebm1d(204.,2.17,3.81,1)| Latitude (degree) | Equil. Temperature (degC) | Equil. Albedo | Absorbed Solar Flux |
|---|---|---|---|
| 5.0 | -29.396811 | 0.62 | 158.42124 |
| 15.0 | -30.048784 | 0.62 | 154.52244 |
| 25.0 | -31.548322 | 0.62 | 145.55520 |
| 35.0 | -33.699834 | 0.62 | 132.68916 |
| 45.0 | -36.503319 | 0.62 | 115.92432 |
| 55.0 | -39.154677 | 0.62 | 100.06920 |
| 65.0 | -42.327613 | 0.62 | 81.09504 |
| 75.0 | -44.348730 | 0.62 | 69.00876 |
| 85.0 | -45.022436 | 0.62 | 64.98000 |
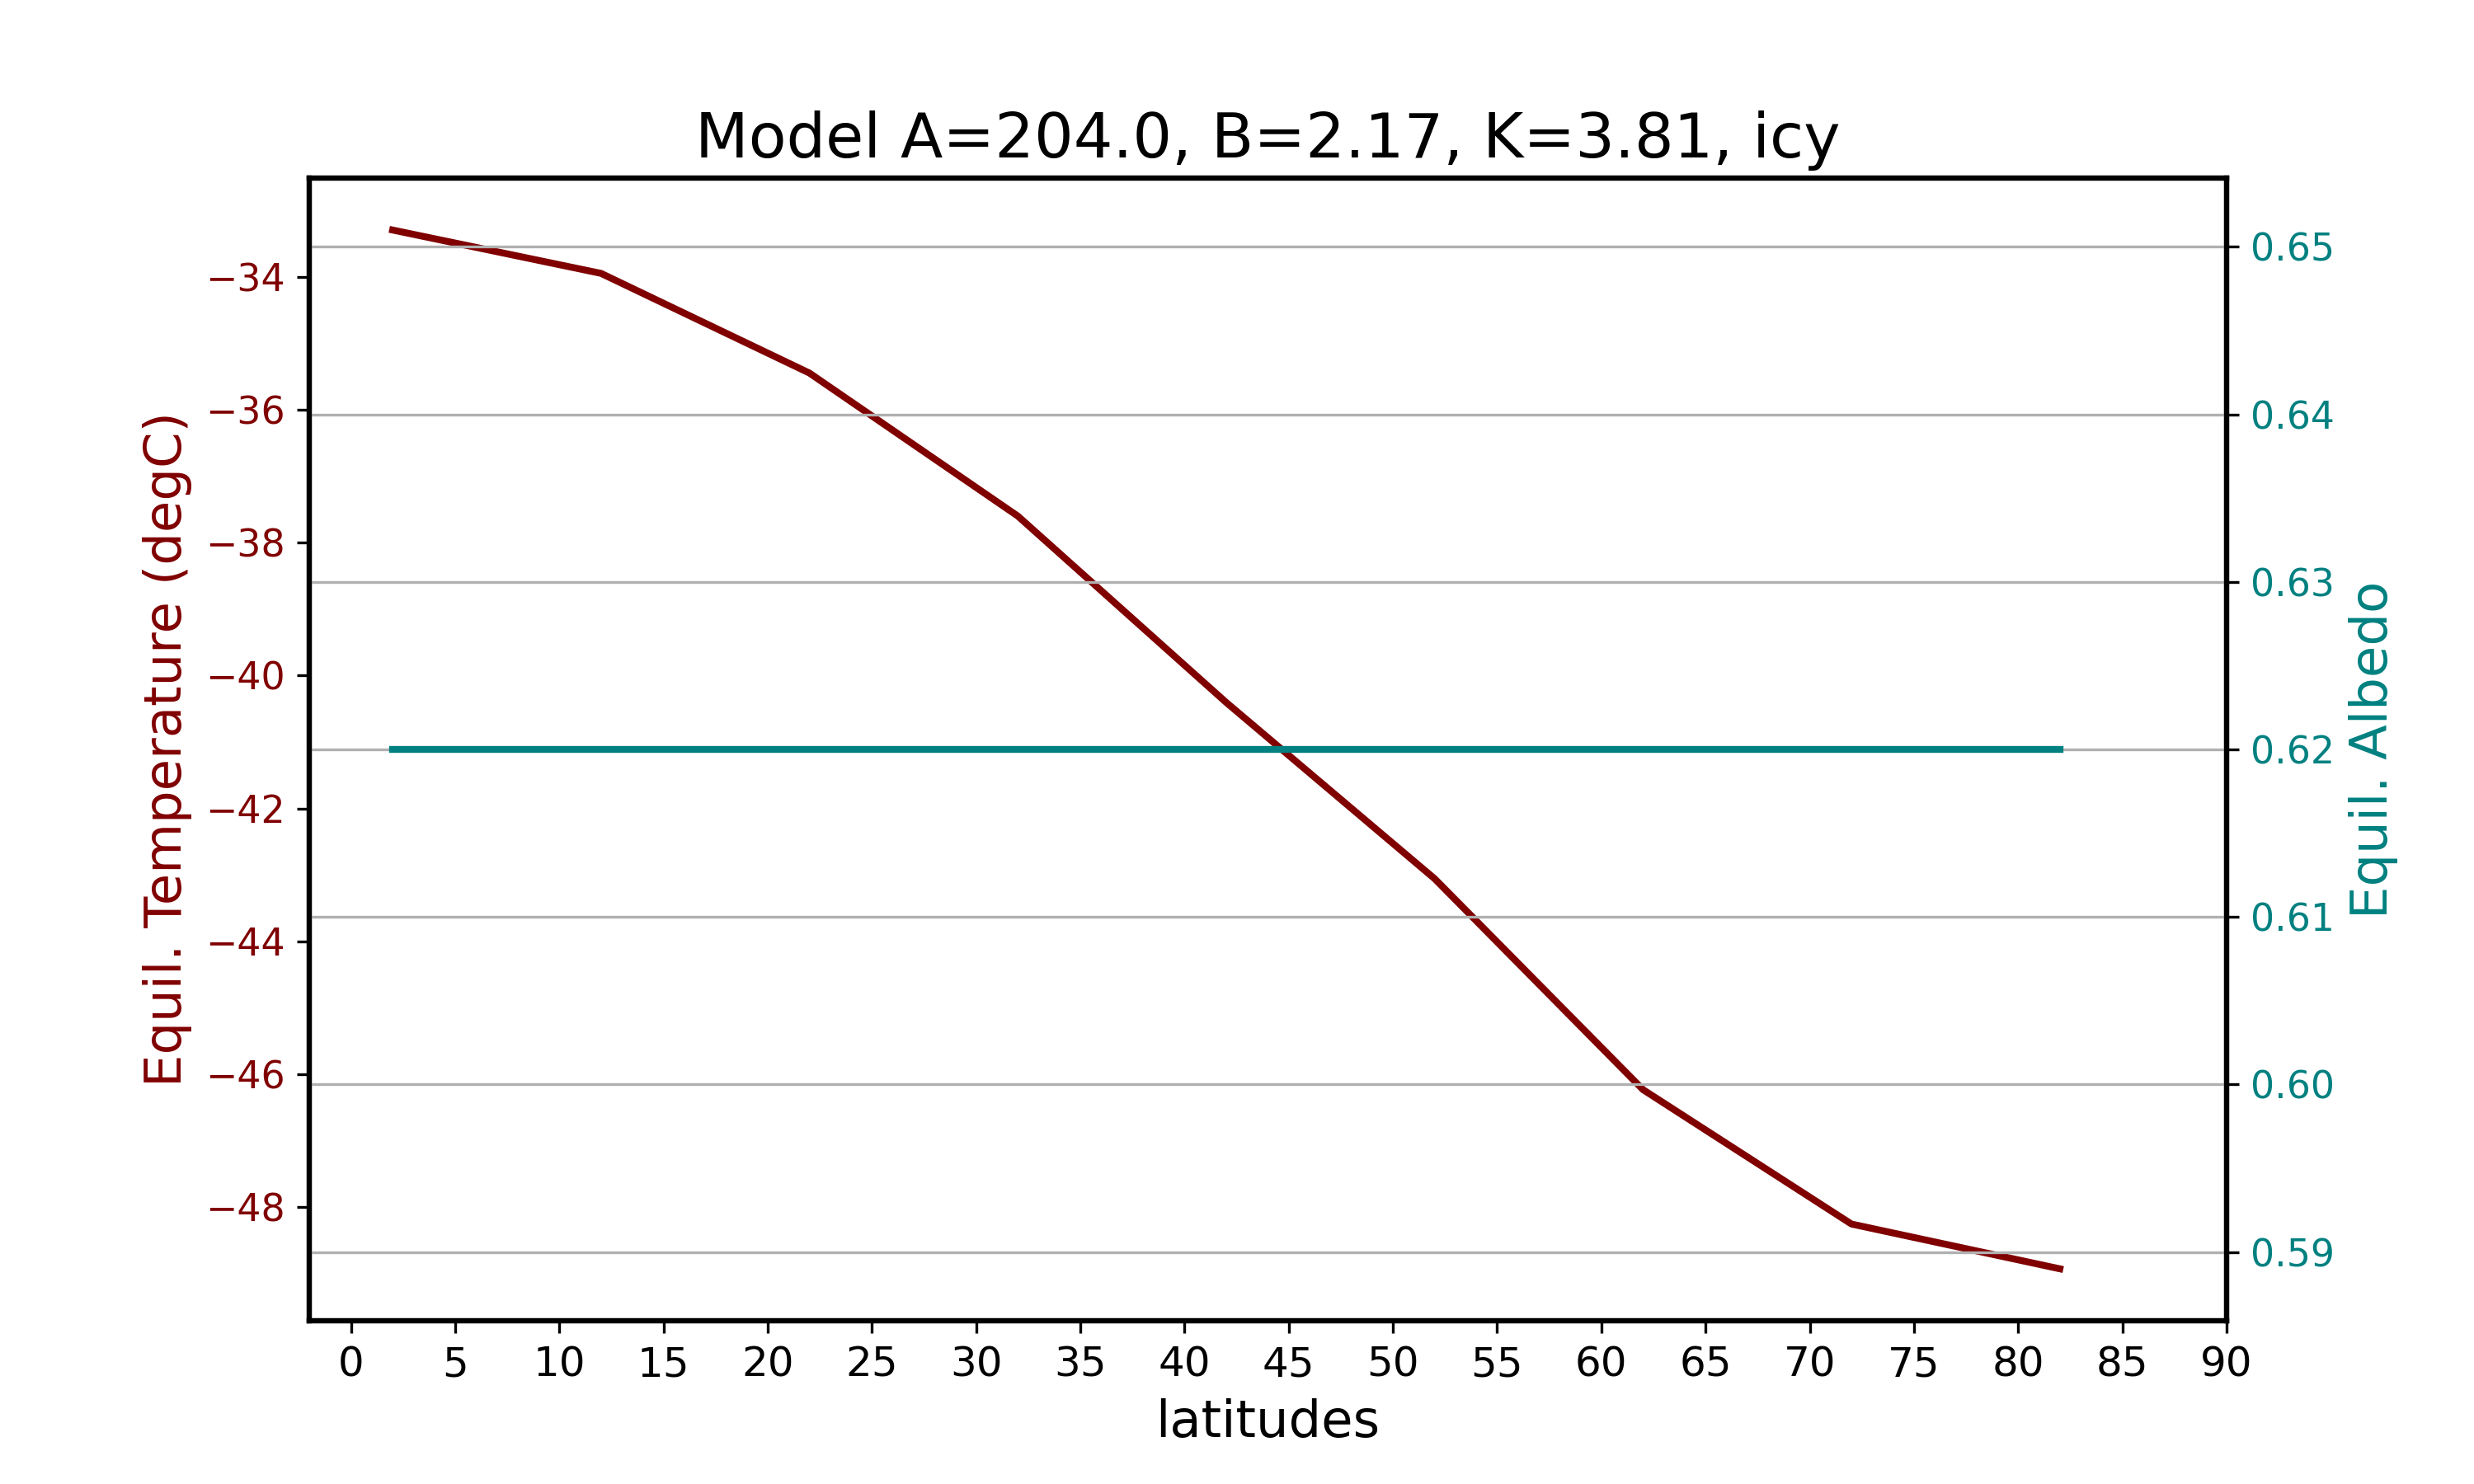 Apparently, the equilibrium albedo remains constant at 0.62 for all bands because this is what I defined in the function for an icy planet (although I think this could be improved by defining more complex assumptions). The equilibrium temperatures and absorbed solar fluxes, on the other hand, both decrease with latitude. We can also see that the temperatures are all extremely low (the highest temperature at the lowest latitude is only -29.4 C). Every band stays below -10 C, the temperature below which the model makes a band fully icy. So the albedo didn’t need to be forced, a planet that starts completely frozen stays frozen under today’s sunlight. The next run uses the same A, B and K and ends up much warmer, so the model has two stable climates for the same sunlight.
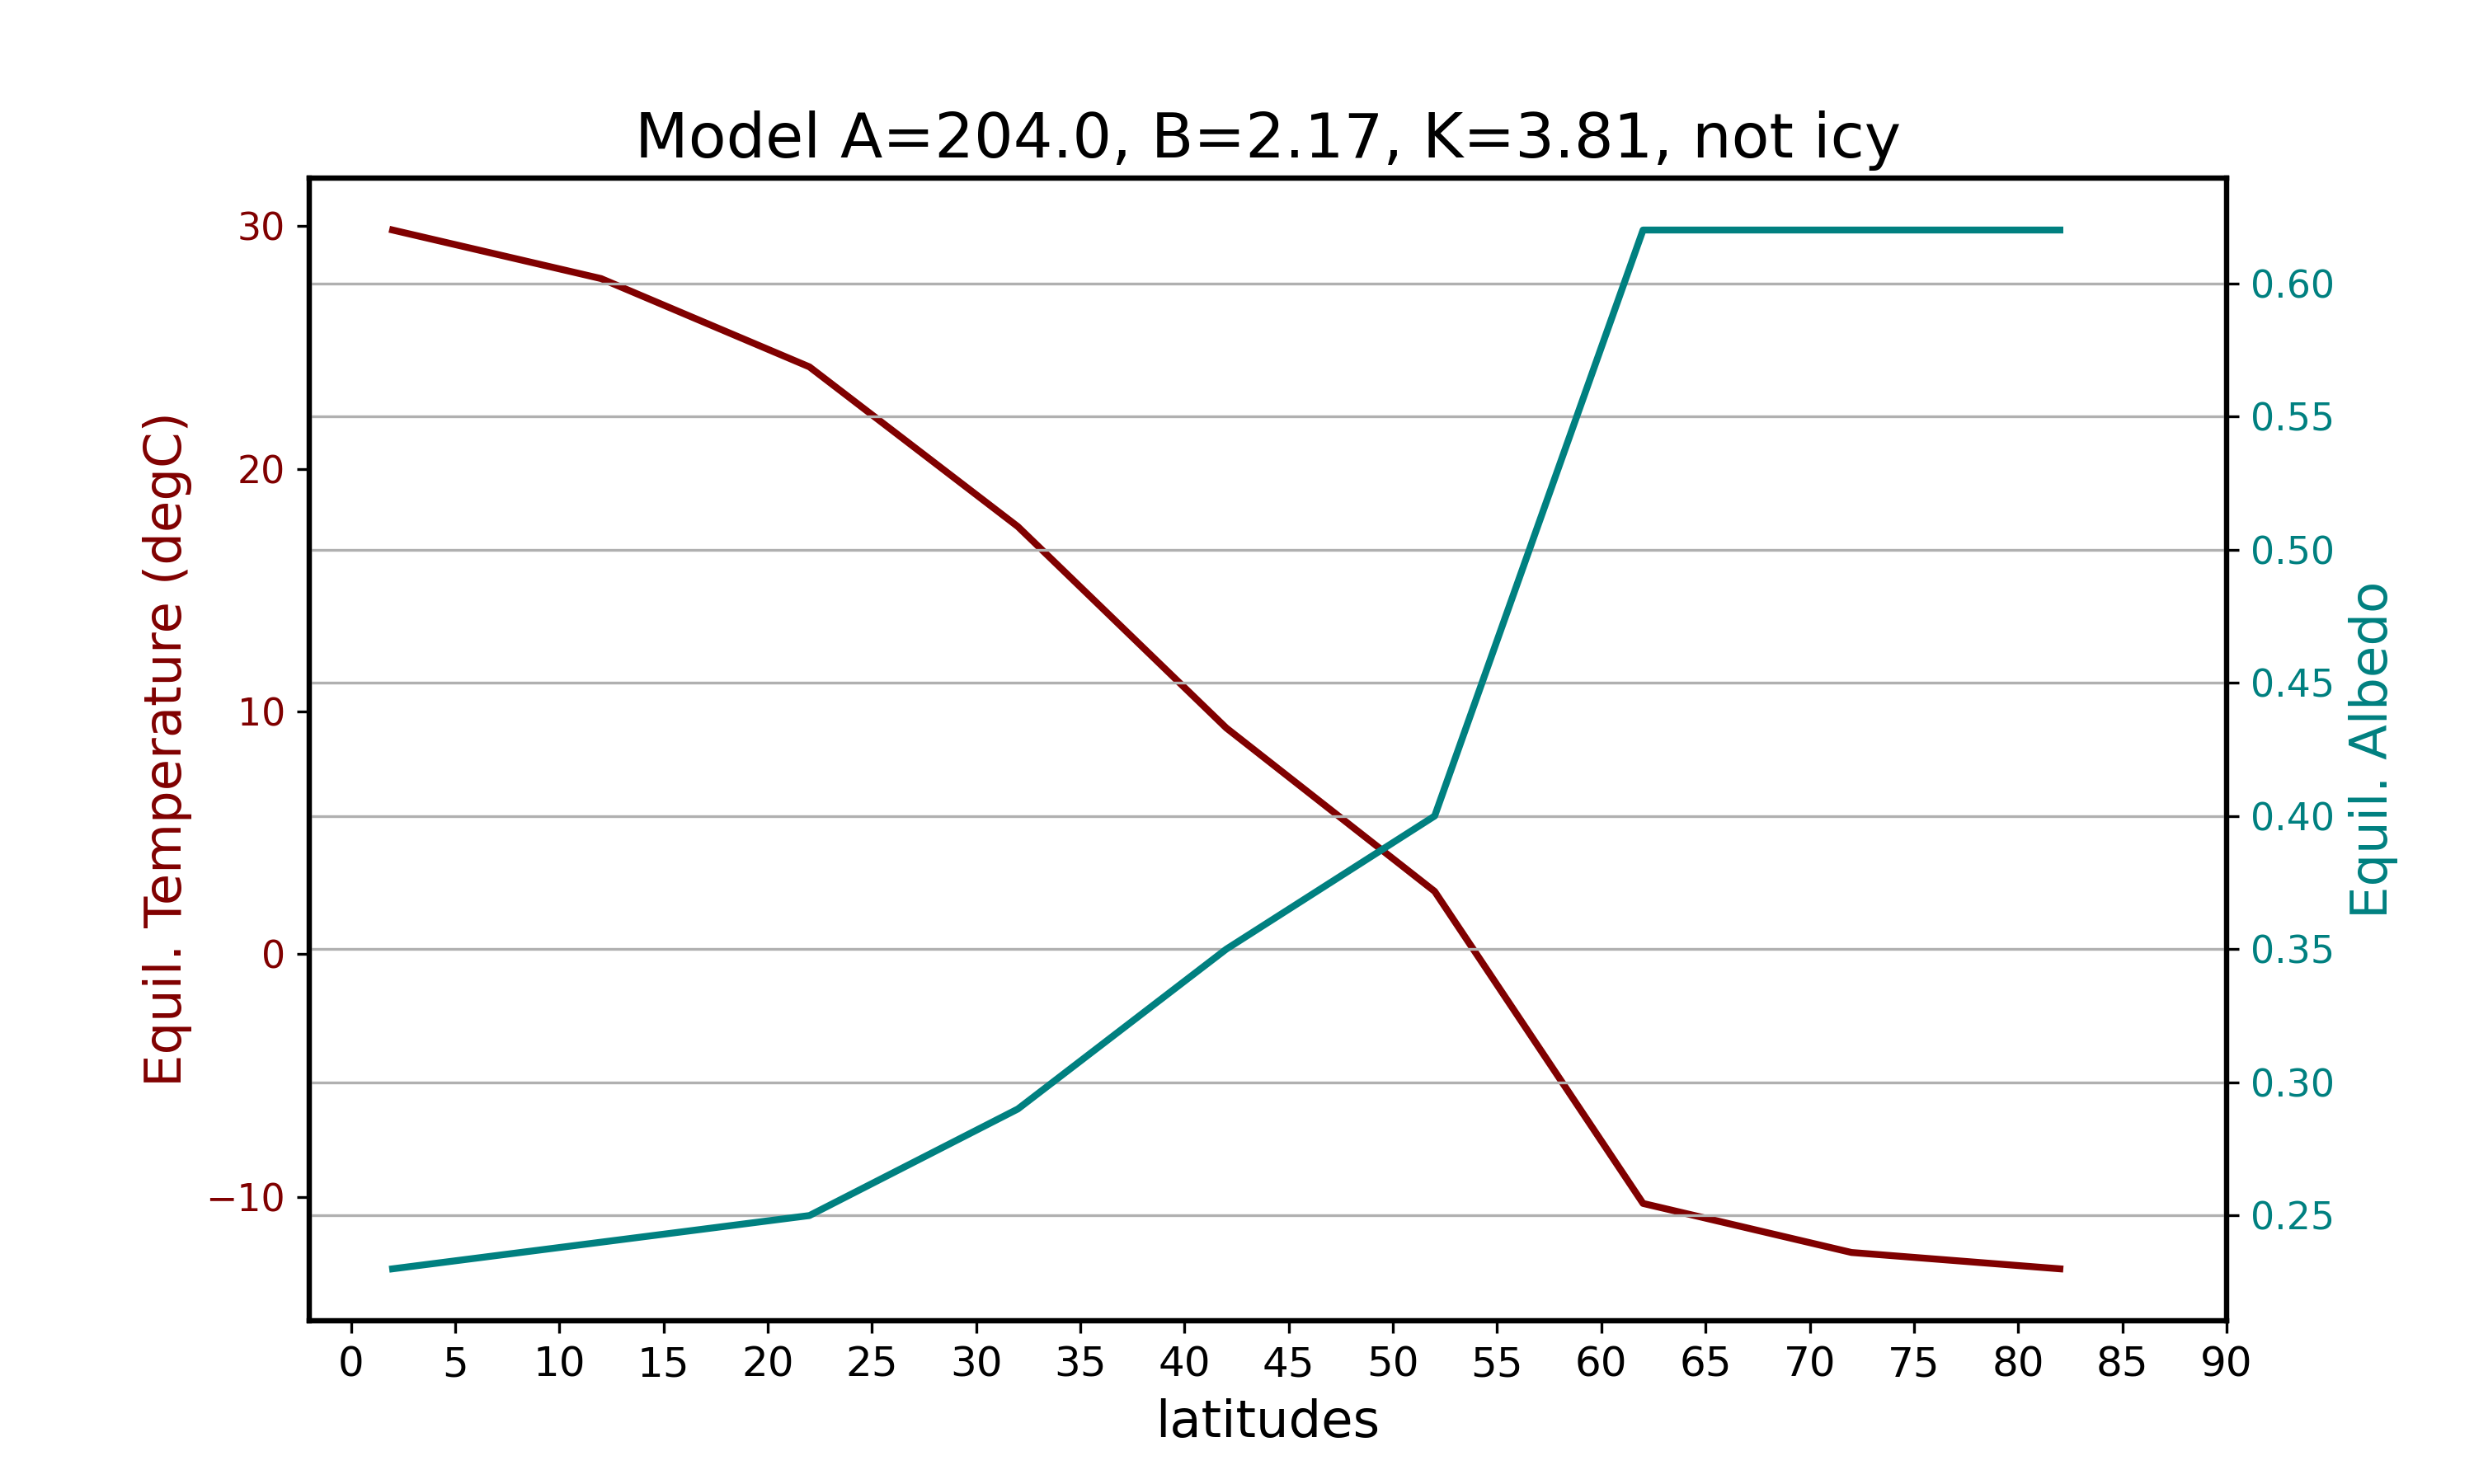
Different K values
Budyko (1969) let .
ebm1d(204.,2.17,3.81,0)| Latitude (degree) | Equilibrium Temperature (degC) | Equilibrium Albedo | Absorbed Solar Flux |
|---|---|---|---|
| 5.0 | 29.806494 | 0.23 | 321.01146 |
| 15.0 | 27.805394 | 0.24 | 309.04488 |
| 25.0 | 24.165782 | 0.25 | 287.28000 |
| 35.0 | 17.583712 | 0.29 | 247.91922 |
| 45.0 | 9.284778 | 0.35 | 198.29160 |
| 55.0 | 2.547722 | 0.40 | 158.00400 |
| 65.0 | -10.313309 | 0.62 | 81.09504 |
| 75.0 | -12.334426 | 0.62 | 69.00876 |
| 85.0 | -13.008131 | 0.62 | 64.98000 |
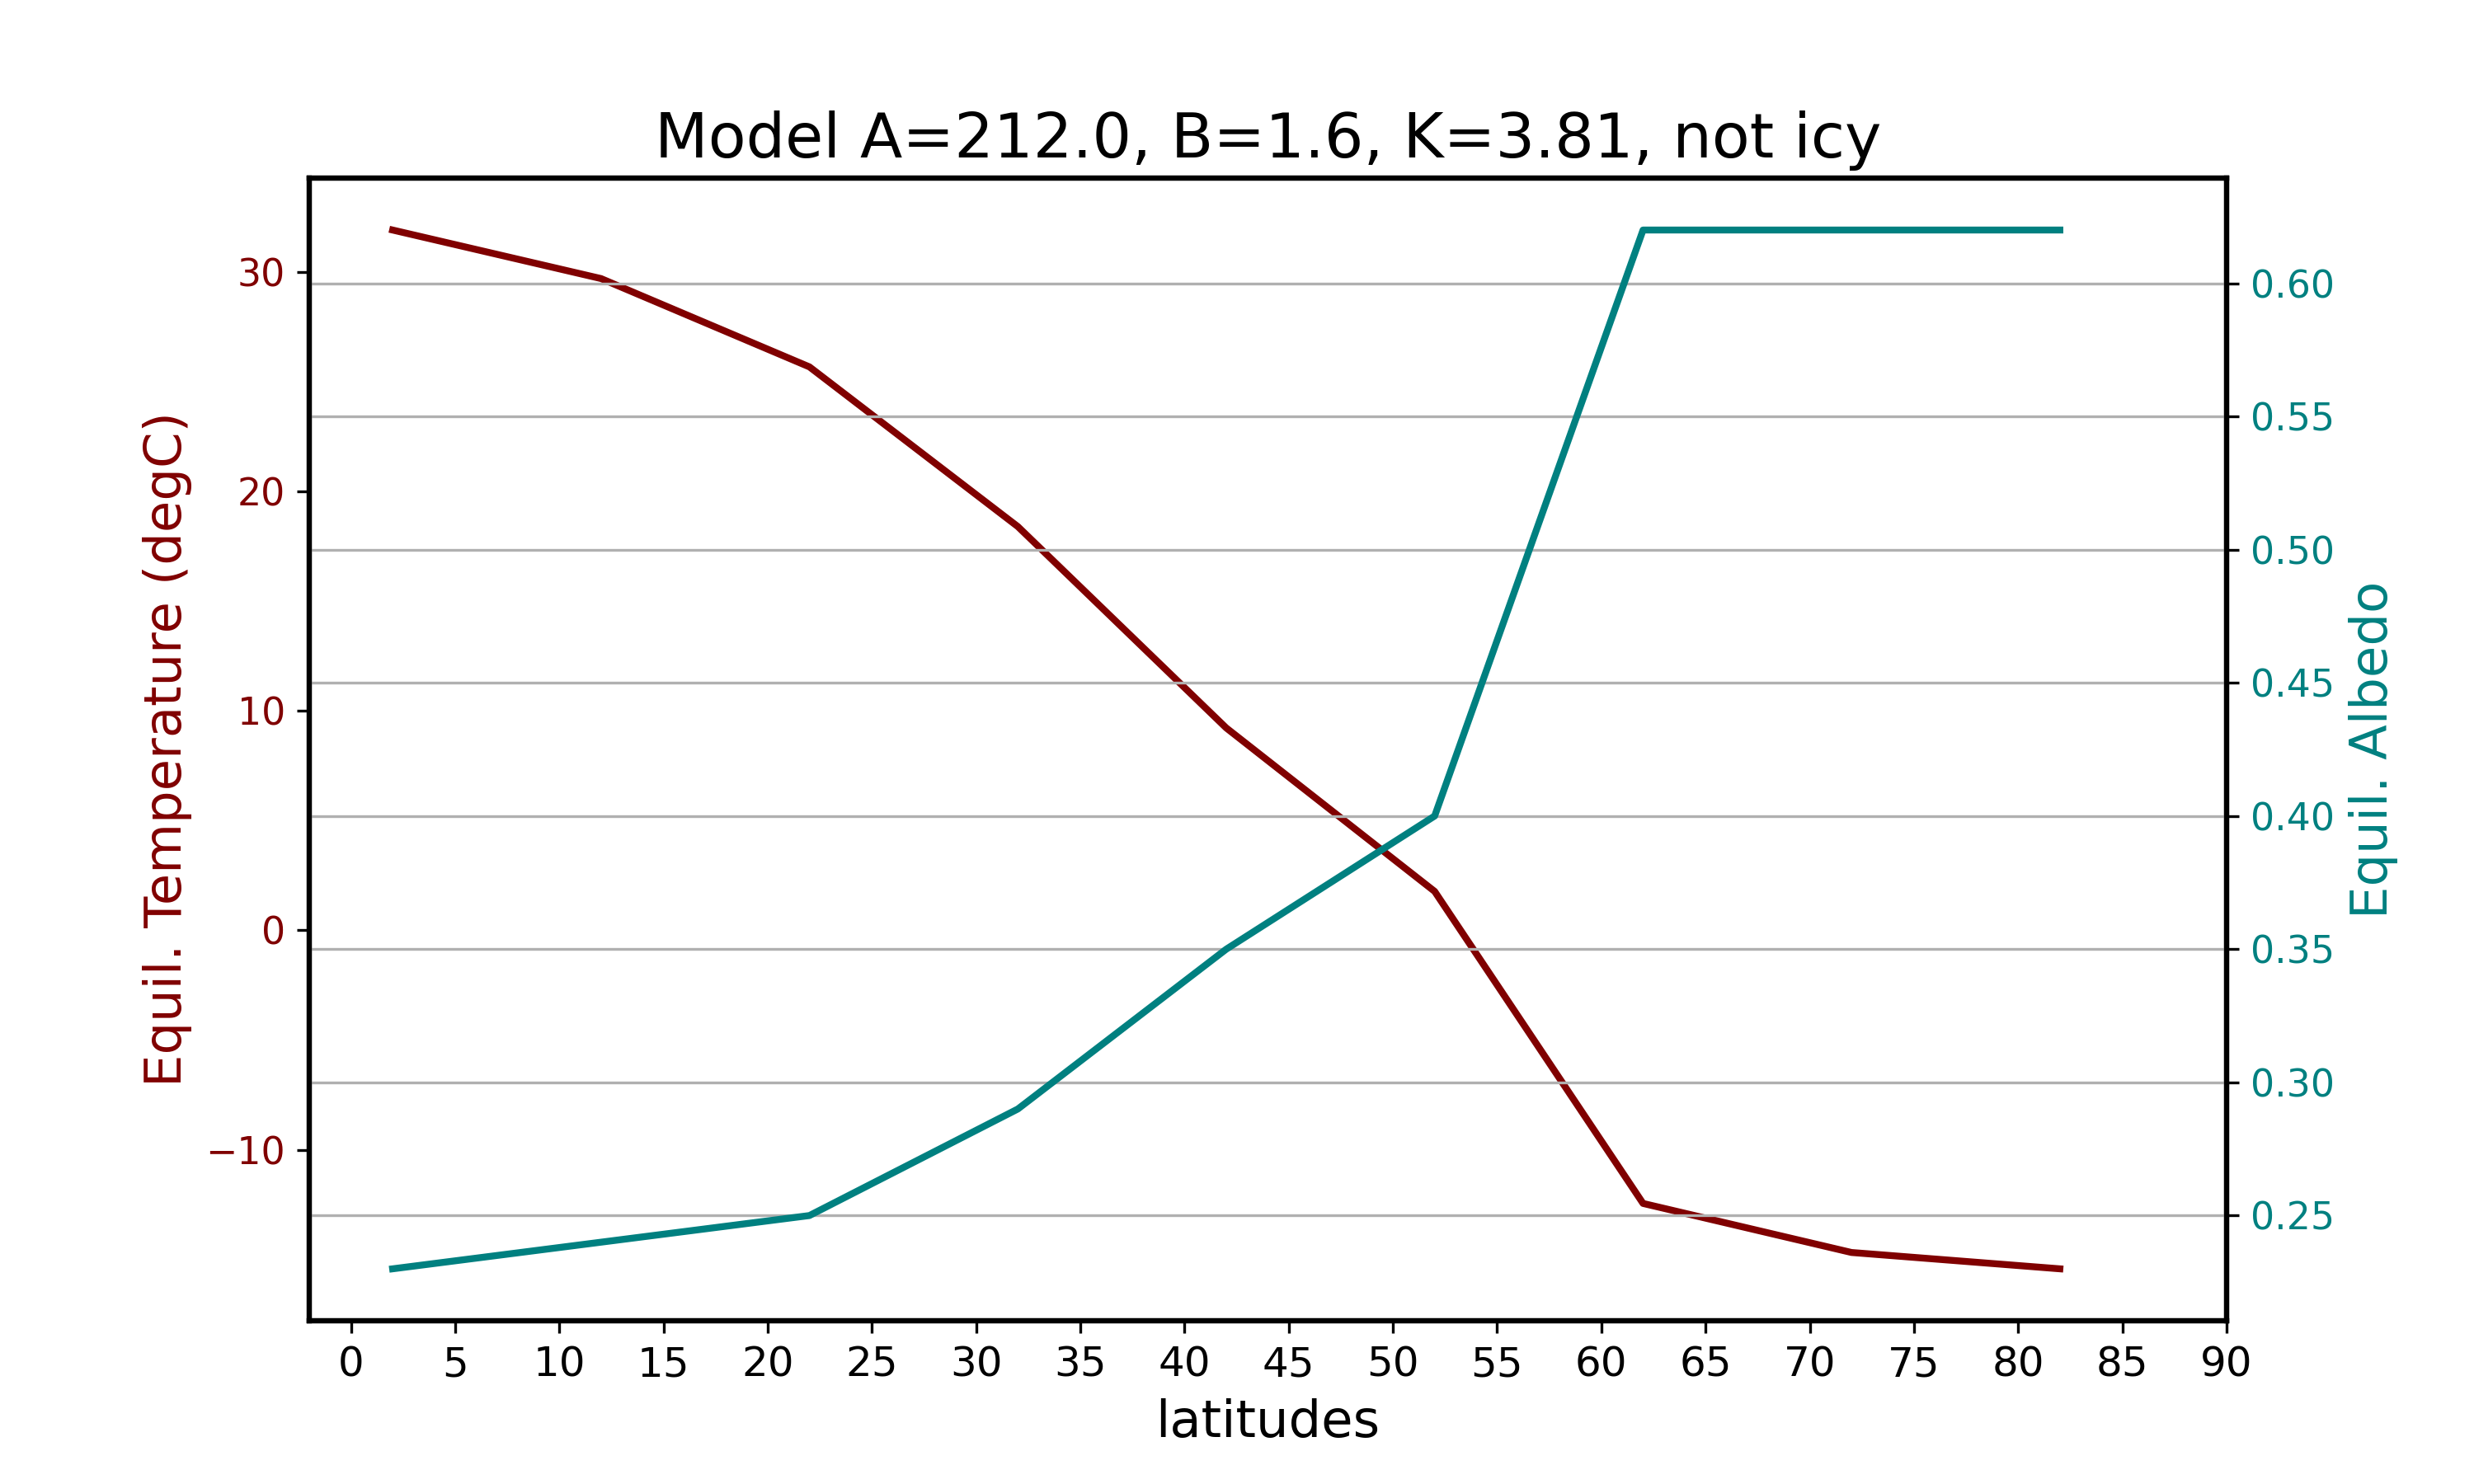
Different A and B values
Budyko (1969) let and .
ebm1d(202.,1.45,3.81,0)| Latitude (degree) | Equilibrium Temperature (degC) | Equilibrium Albedo | Absorbed Solar Flux |
|---|---|---|---|
| 5.0 | 42.820299 | 0.230000 | 321.011460 |
| 15.0 | 40.545284 | 0.240000 | 309.044880 |
| 25.0 | 36.407474 | 0.250000 | 287.280000 |
| 35.0 | 28.924436 | 0.290000 | 247.919220 |
| 45.0 | 19.489527 | 0.350000 | 198.291600 |
| 55.0 | 11.830287 | 0.400000 | 158.004000 |
| 65.0 | 3.700310 | 0.460000 | 115.240320 |
| 75.0 | -1.615077 | 0.519381 | 87.281383 |
| 85.0 | -3.203457 | 0.538441 | 78.926504 |
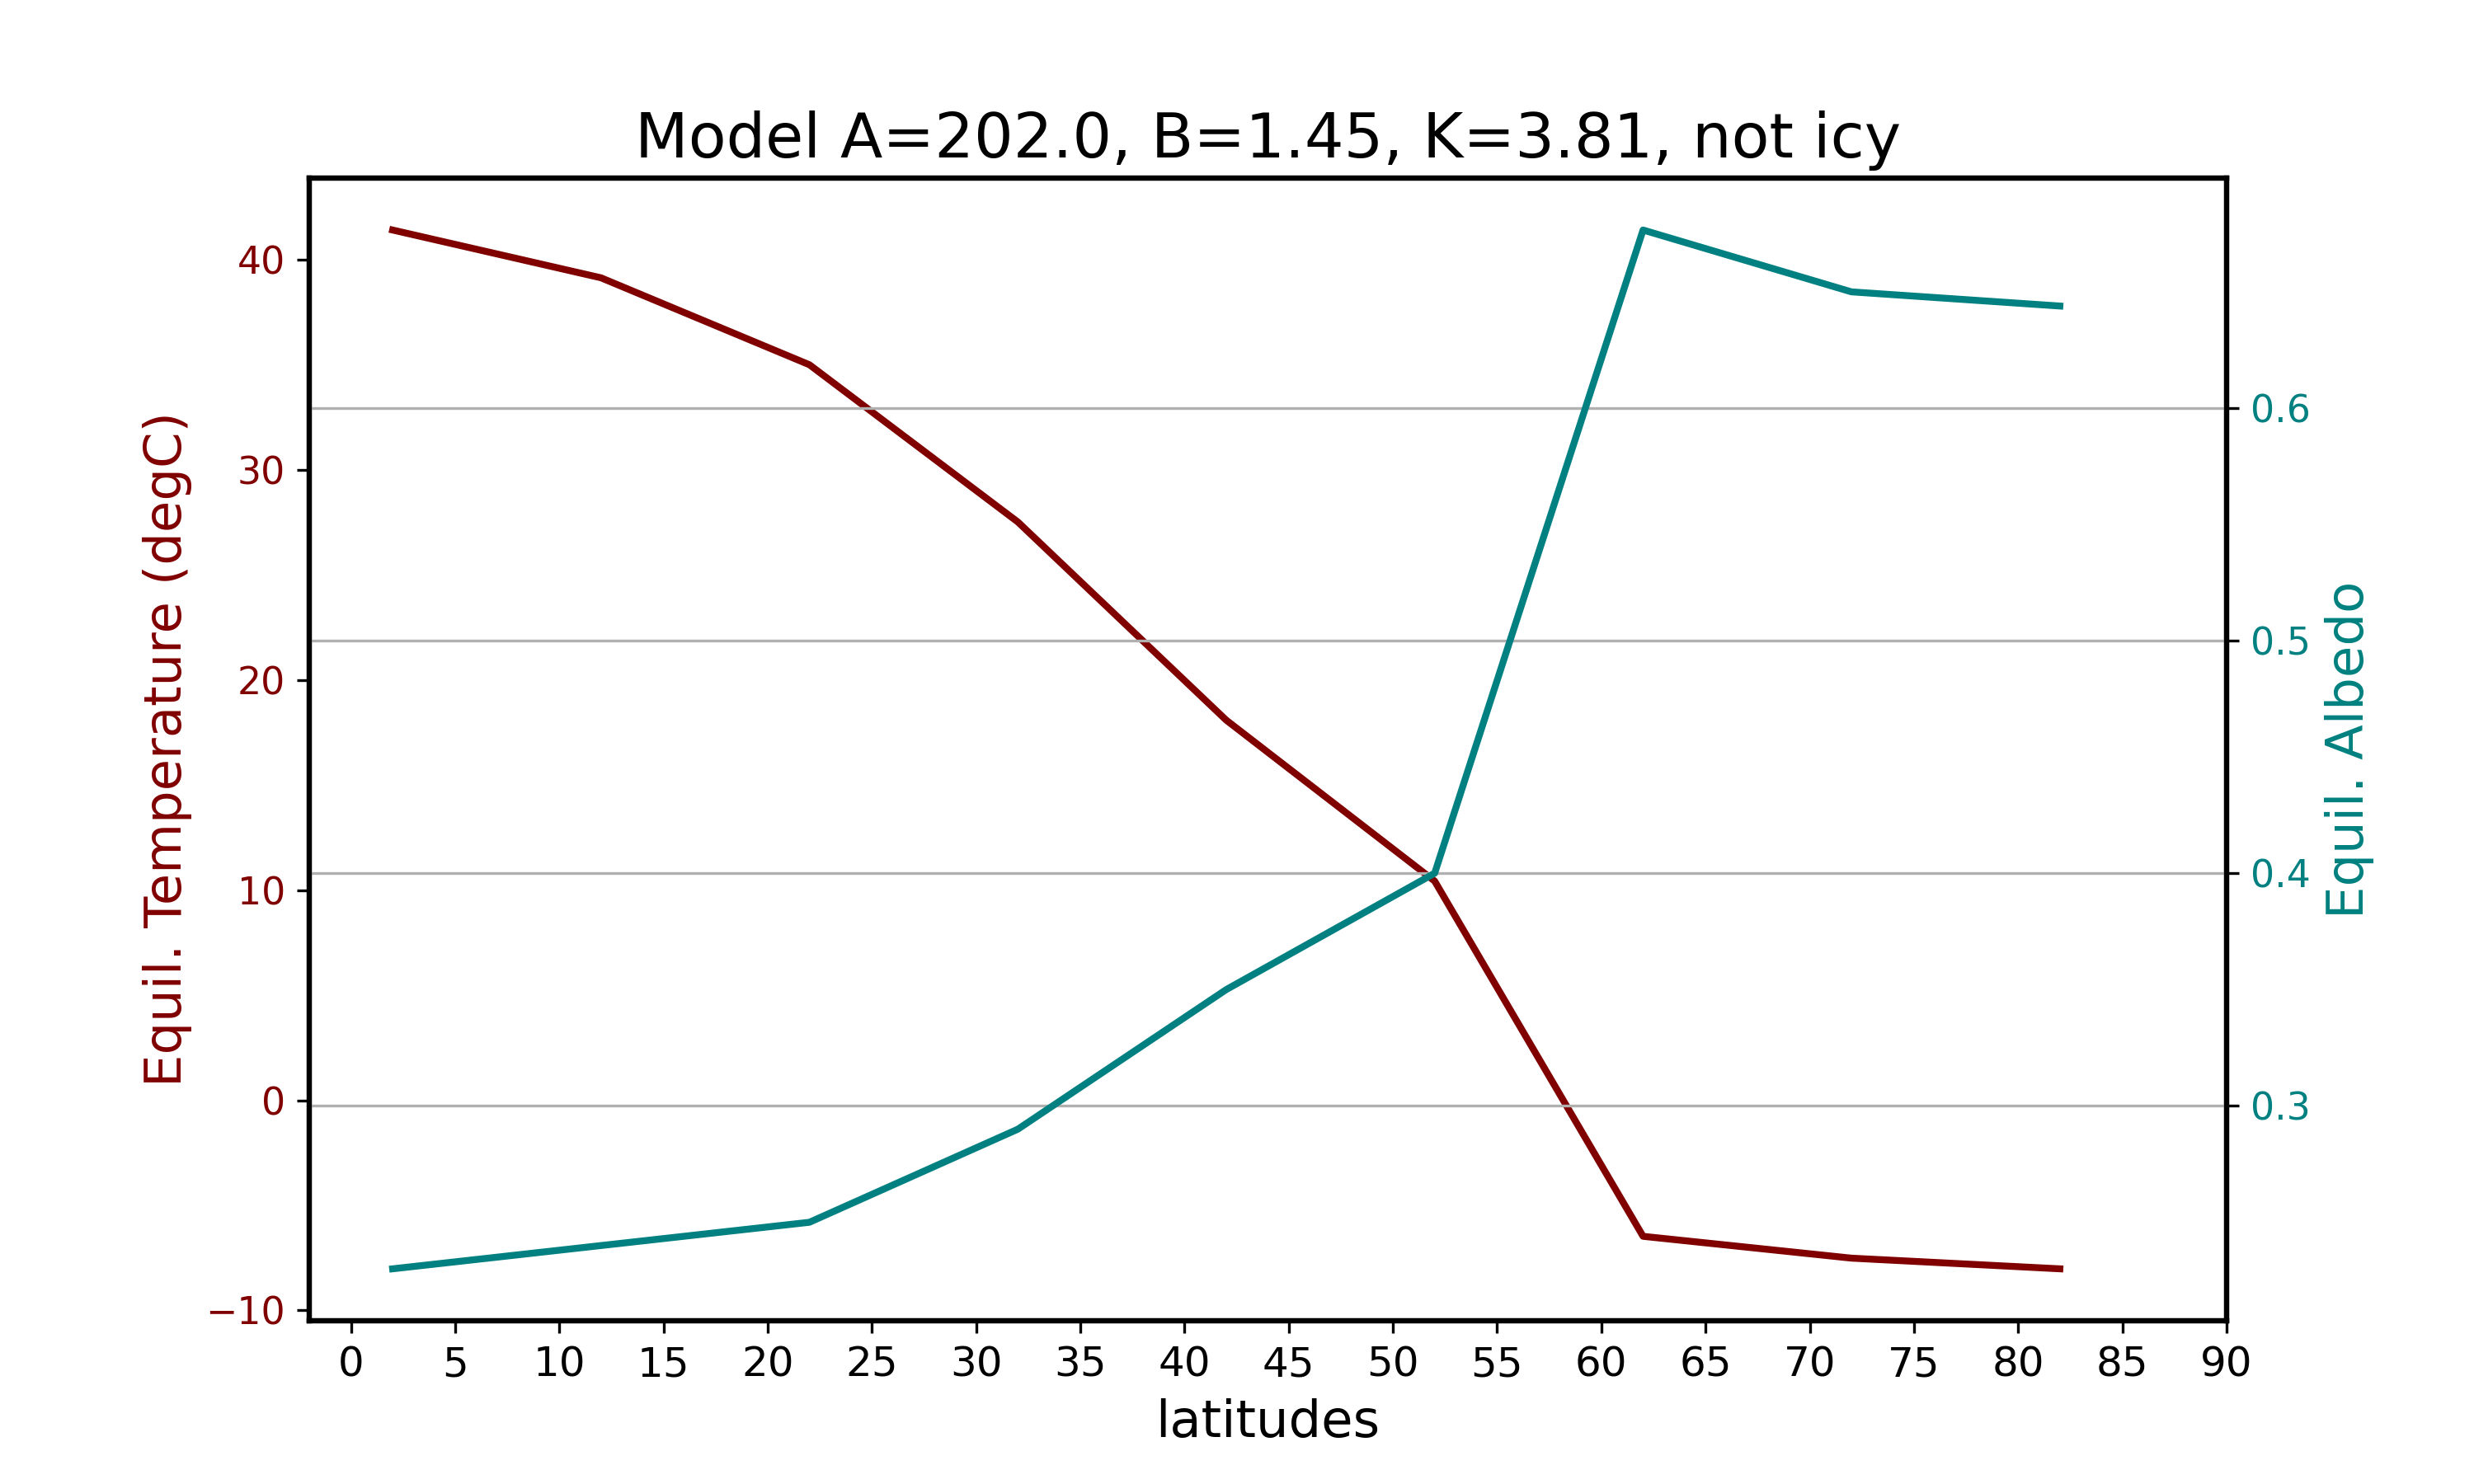
Cess (1976) let and .
ebm1d(212.,1.6,3.81,0)| Latitude (degree) | Equilibrium Temperature (degC) | Equilibrium Albedo | Absorbed Solar Flux |
|---|---|---|---|
| 5.0 | 31.979023 | 0.23 | 321.01146 |
| 15.0 | 29.767086 | 0.24 | 309.04488 |
| 25.0 | 25.744002 | 0.25 | 287.28000 |
| 35.0 | 18.468442 | 0.29 | 247.91922 |
| 45.0 | 9.295130 | 0.35 | 198.29160 |
| 55.0 | 1.848254 | 0.40 | 158.00400 |
| 65.0 | -12.367820 | 0.62 | 81.09504 |
| 75.0 | -14.601883 | 0.62 | 69.00876 |
| 85.0 | -15.346571 | 0.62 | 64.98000 |